The term liquidity refers to different aspects of markets, such as price impact, time-to-fill, and probability of fill of various orders. Although the term "liquidity" is widely used in finance literatures, its meaning is loosely defined and there is no quantitative measure for it. Generally, "liquidity" means an ability to quickly trade stocks without causing a significant impact on the stock price. From this definition, we identified two facets of liquidity (1) execution time and probability of execution of limit orders, and (2) price impact of market orders. The limit order is an order to transact a prespecified number of shares at a prespecified price, which will not cause an immediate execution. On the other hand, the market order is an order to transact a prespecified number of shares at market price, which will cause an immediate execution, but are subject to price impact. Based on the difference in methods of executions, we call traders placing limit and market orders liquidity providers and liquidity takers respectively.
The goal of this project is to learn if there is any liquidity imbalance in the market and explore the possibility of utilizing this information in market-making. There exist both advantage and disadvantage of being a liquidity provider or a taker. For liquidity providers (limit order placers), they have an advantage of executing their orders at desirable price, but subject to a risk of order not executing at all. For liquidity providers (market order placers), they have an advantage of having their orders executed immediately, but subject to causing the impact on the market price.
Theoretically for any given state of liquidity, the expected price that liquidity takers pay for the immediate executions should equal to the expected price that liquidity providers gain by waiting. When these two values are different, we say there exists an liquidity imbalance in the market.
There is a substantial literature on theoretical market-making models which are developed in the context of stochastic dynamic programming. The main limitation of these models is that underlying price and order arrival processes have to be assumed in order to solve the optimal strategies. A number of papers develop optimal market-making behavior in certain theoretical contexts [1,3,5,8,9]. In order to overcome such limitation, adaptive learning model for market-making is introduced [2,6]. In this work, a reinforcement learning was used to adapt market-making strategies from a simulated environment.
In this project we plan to explore the alternative market-making algorithm by learning liquidity imbalance. For instance, when the expected loss for liquidity takers is greater than the expected gain for liquidity providers, this refers to lack of liquidity in the market, which may be a signal for market-maker to provide more liquidity by placing more limit orders or tightening a bid/ask spread. For an opposite case, market-maker can withdraw liquidity by increasing a bid/ask spread or canceling their unfilled limit orders.
We are interested in identifying the liquidity imbalance occurring within the bid/ask spread. The expected gain for the limit orders placed within bid/ask spread can be calculated by averaging the difference between the limit price and the opposite best price multiply by the probability of execution rho:

In order to calculate the expected price impact of market orders corresponding to the limit order placed within bid/ask spread, we have to first determine the expected time-to-fill of those limit orders. Previously we introduced a model describing execution times of limit orders [7]. From the analysis of financial data, we learned that the distributions of limit order execution times has Weibull like body with fatter tail. We introduced a generalized form of Weibull distribution, which has an extra parameter controlling the fatness of the tail. This is called a q-Weibull distribution which has following PDF form with three parameters alpha, lambda, and q:


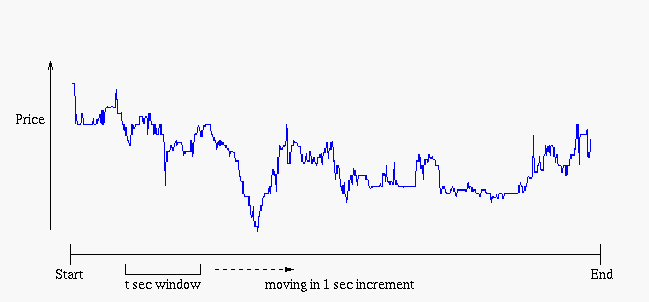
After knowing the expected execution time t of limit orders, we determine the expected price impact experienced by liquidity takers. This can be calculated by looking at changes of transaction prices in the same trading period that we have used for analyzing the execution times of limit orders. As described in the following figure, we calculated the mean of price change within time window of length t within the same trading period.

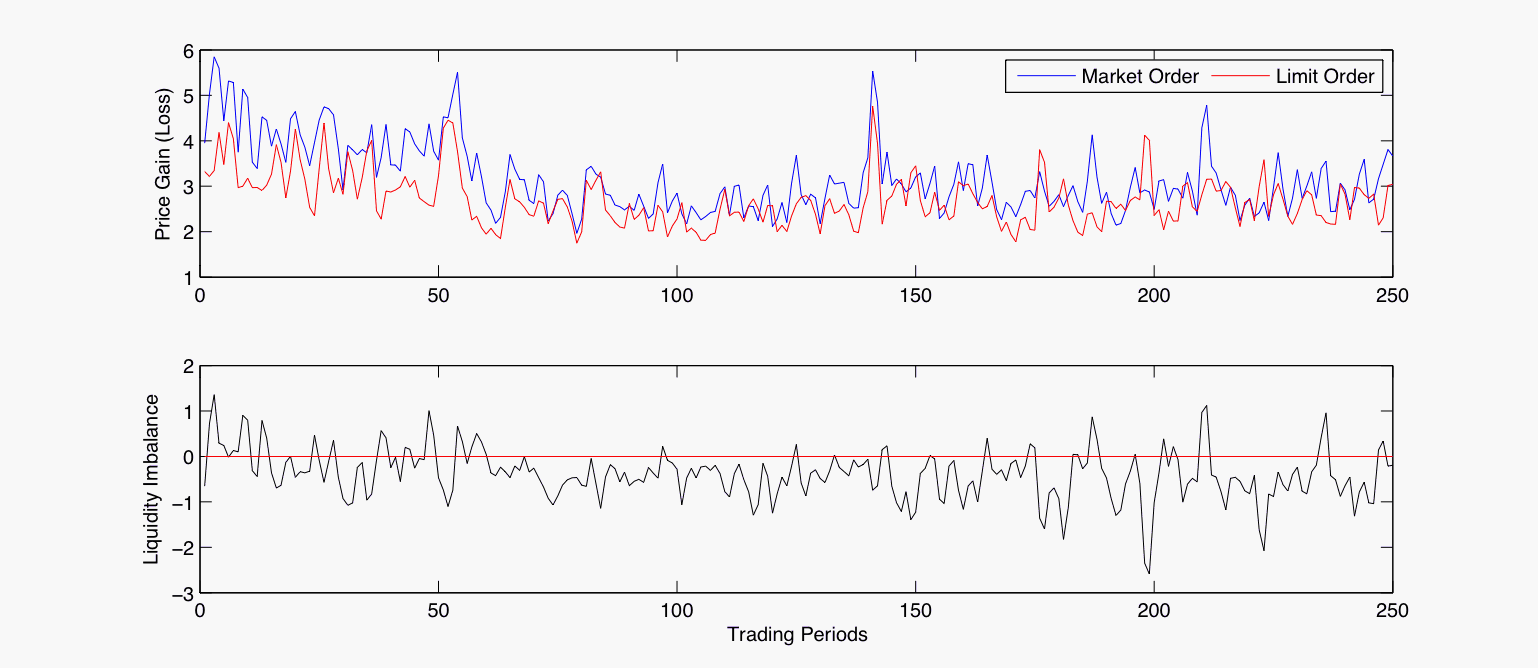
The following figure shows the liquidity imbalances calculated using the above method for 250 segments of trading periods. The top figure shows the price gains and losses of limit and market orders. Although they are strongly correlated, we identified the existence of liquidity imbalance. The bottom figure shows the difference between gains and losses. The negative value indicates the expected loss of liquidity takers are greater than the gains of liquidity providers. These are the periods where more liquidity can be provided by placing more limit orders or tightening the bid/ask spread. The opposite case is also observed in the figure which refers to excess of liquidity.

We will study if the new automated market-making algorithm can be introduced by utilizing the information of liquidity imbalance. This does not involve any assumptions about underlying price and order arrival processes. Also, it is different approach from reinforcement learning method since it utilizes passive information of the market rather than speculating from the previous experiences. We are planning to run experiments under the dynamic orderflow model that we have introduced in [6].
This report describes research done at the Center for Biological & Computational Learning (CBCL), Santa Fe Institute, and MIT Laboratory for Financial Engineering.
The CBCL is in the McGovern Institute for Brain Research at MIT, as well as in the Dept. of Brain & Cognitive Sciences, and which is affiliated with the Computer Sciences & Artificial Intelligence Laboratory (CSAIL).
Additional support was provided by Barclay's Bank.
[1] Y. Amihud and H. Mendelson. Dealership Market: Market-Making with Inventory. Journal of Financial Economics, 8, pp. 31--53, 1980.
[2] N. Chan and C.R. Shelton. An Electronic Market-Maker. Seventh International Conference of the Society for Computational Economics, 2001.
[3] M. Garman. Market Microstructure. Journal of Financial Economics, 1976.
[4] L.R. Glosten and P.R. Milgrom. Bid, Ask and Transaction Prices in a Specialist Market with Heterogeneously Informed Traders. In Journal of Financial Economics, 14:71--100, 1985.
[5] T. Ho and H.R. Stoll. Optimal Dealer Pricing Under Transactions and Return Uncertainty. Journal of Financial Economics, 1981.
[6] A.J. Kim, C.R. Shelton, and T. Poggio. Modeling Stock Order Flows and Learning Market-Making from Data. Technical Report, MIT AI Lab, AI Memo 2002-009, 2002.
[7] A.J. Kim, J.D. Farmer, and A.W. Lo. Modeling Limit Order Removal Times from Market Data with q-Weibull Distribution. Working Paper, Santa Fe Institute, 2007.
[8] A.S. Kyle. Continuous Auctions and Insider Trading. Econometrica, 53, pp. 1315--1335, 1985.
[9] M. O'Hara and G. Oldfiled. The Microeconomics of Market-Making. Journal of Financial and Quantitative Analysis, 1986.