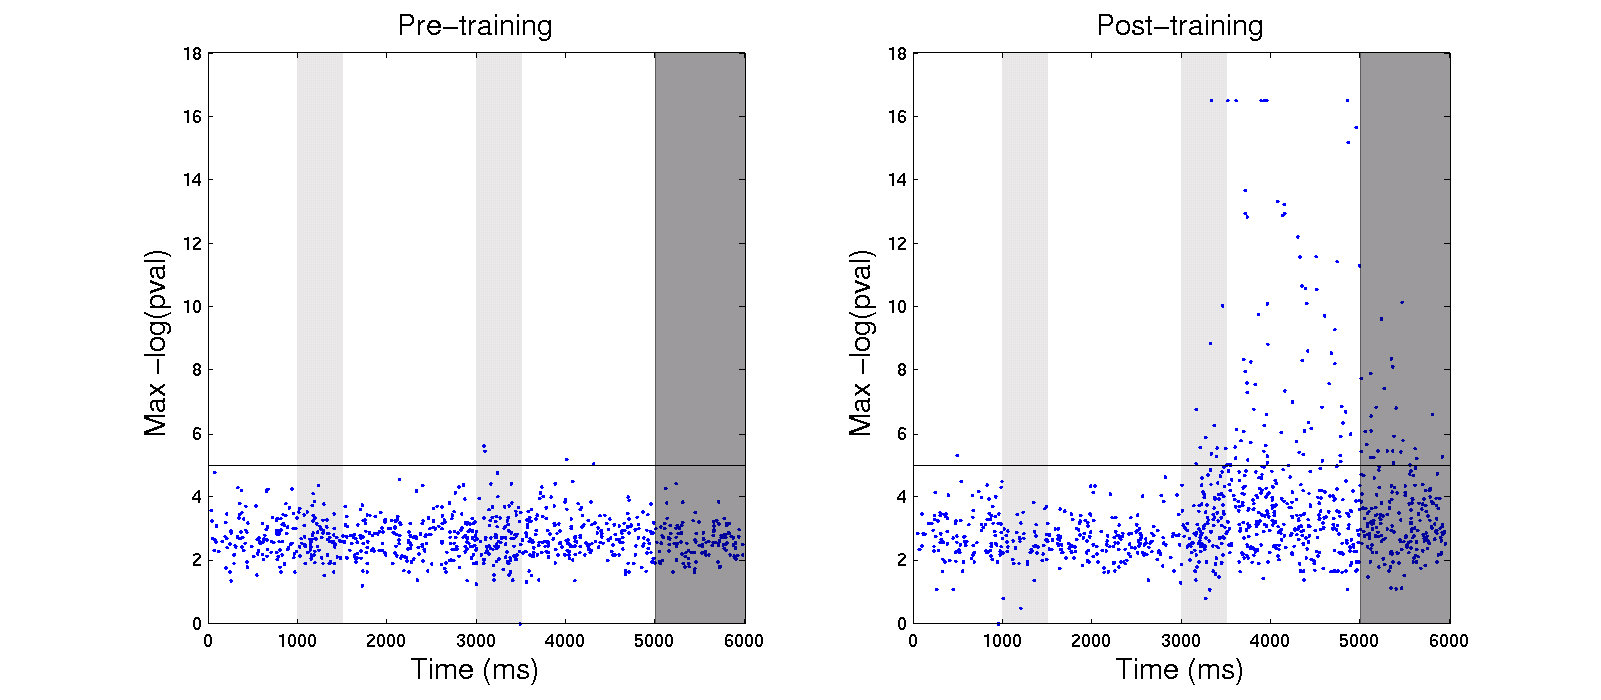
The figures below show plots of the match/nonmatch maximum ANOVA -log10(p-values) for each neuron plotted at the time when a given neuron had its maximum value (i.e., these are the same as Figs. 2c and S3c but the values plotted are -log10(p-values) rather than eta squared values). Each point on this point represents one neuron (neurons with p-values of 0, are assigned a maxium -log10(p-value) of ~16). As can be seen, few neurons have very small p-values less than 10^-5 before training, and after training many neurons have much smaller p-values. Upper plots are analyses from the feature experiment and lower plots are from the spatial experiment.
