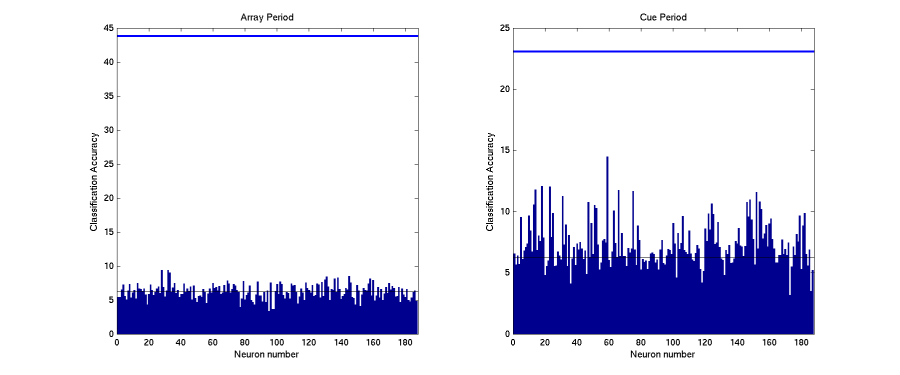
Below are the results from decoding the identity of the 16 objects using the firing rates from only one single neuron at a time. The top plot shows the classification accuracies for each of the 187 neurons during the array period (300 ms that starts 100 ms after stimulus onset, left subplot), and from the cue period (310 ms bin, starting 200 ms after the onset of the cue). The bottom plot shows the results for each neuron as a function of time. The blue lines show the decoding accuracy using the full population of 187 neurons, and the black horizontal lines shows chance performance. Because the correlation coefficient can not be calculated using single neurons, the results in these figures are based on using an Euclidean distance classifier. The results are much better when all neurons from the population are used together which is most likely due to the fact that different neurons respond selectively to different stimuli, and that the population classifier can average the responses over many neurons which can drastically reduce the noise on a single trial.
