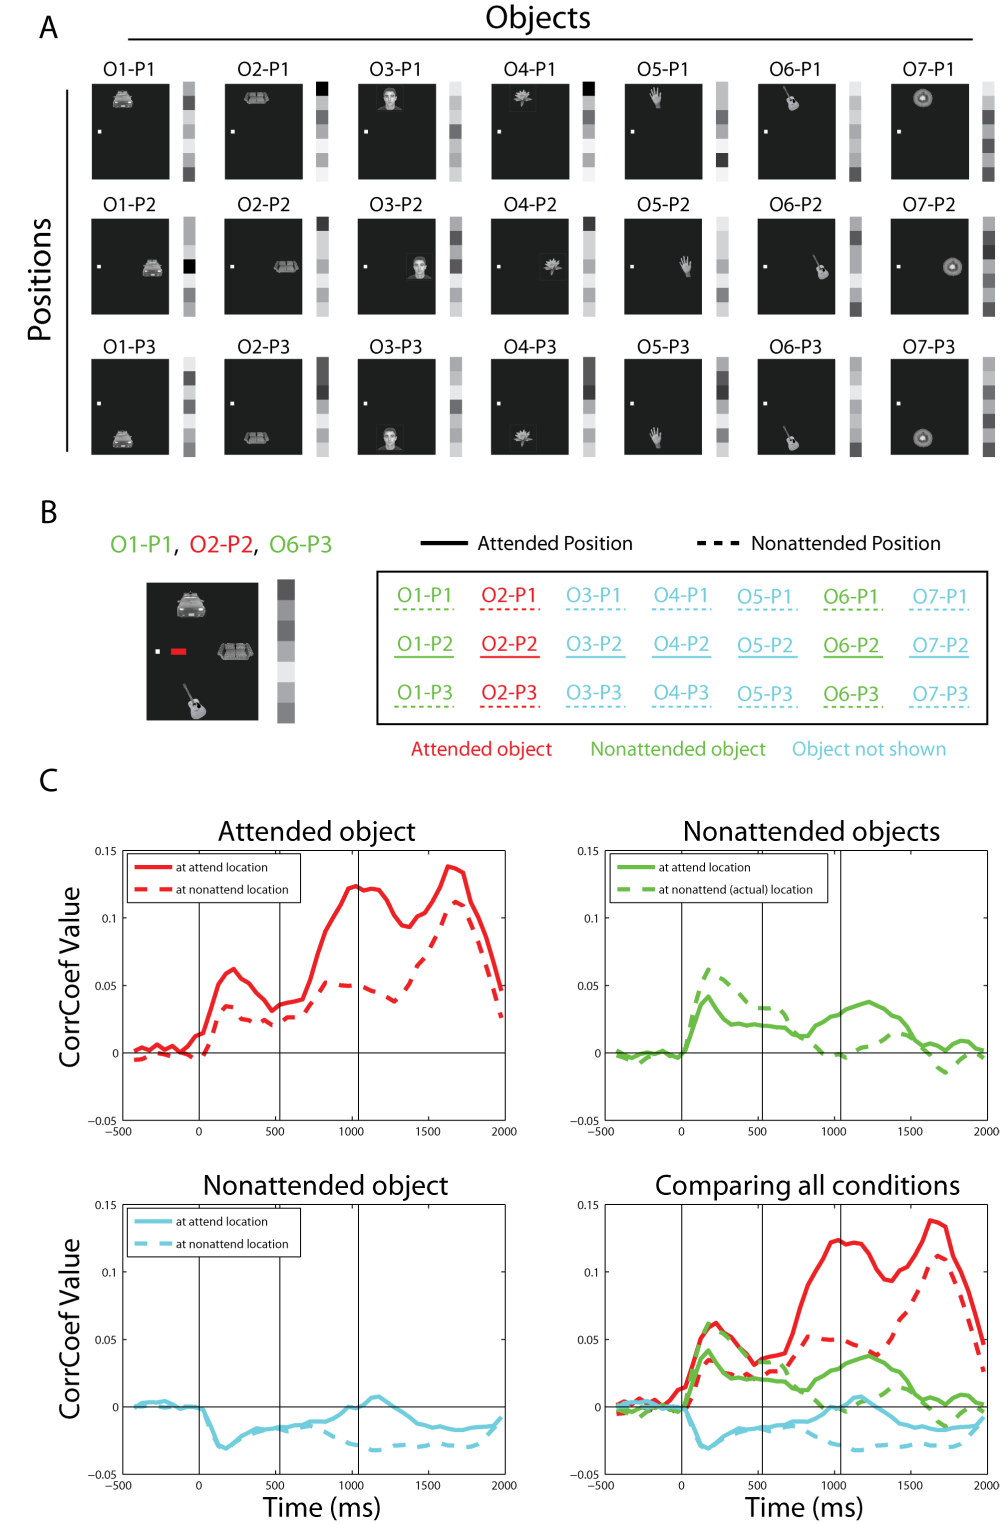
A, illustration showing that each object at each position generates a particular pattern of neural activity, which we call the 'population representation' of a particular object at a particular location. For this analysis we create the population representations of each object at each position using data from the isolated object trials, and then we correlate these population representations with data from cluttered object trials. B, Illustration showing that the cue creates both an 'attended object' and an 'attended location'. In this example, attention is directed to object 2 at position 2. If attention affects object and position information independently, then we might expect the population activity on this cluttered trial to be similar to the population representations that share the same identity as the attended object, and to the population representations that share the same position as the attended object. Thus, for this example, we would expect the population activity to be similar to the population representations that contain object 2 (red representations in the second column on the right of the figure), and to be similar to the population representations that contain an object at position 2 (solid underlined representations in row two on the right of the figure). C, The plot on the upper left shows the correlation coefficient between the cluttered data and population representation of the attended object at the attended location, and also the correlation coefficient between the cluttered data and the population representation of the attended object at the nonattended locations. As can be seen, there is more similarity between cluttered data and the population representation of the attended object at the exact attended location, then there is with the population representations of the attended object at nonattended locations. The plot on the upper right shows the correlation coefficient between the cluttered data and population representations of the nonattended object at the attended location, and also the correlation coefficient between the cluttered data and the population representations of the nonattended object at the actual location these nonattended objects were shown. As can be seen, prior to the onset of the attentional cue, there is a higher correlation between the cluttered data and the population representation of nonattended objects at the actual locations they were shown, than the population representations of the nonattended objects at the location that will be attended. However, after the onset of the attentional cue, the cluttered data more closely resembles the population representations of the nonattended objects at the attended locations, than it does the nonattended objects at the actual locations they are on the screen. The plot on the lower left shows the correlation coefficient between the cluttered data and population representation of the objects that were not shown at the attended location, and also the correlation coefficient between the cluttered data and the population representations of the objects that were not shown at the nonattended locations. As can be seen, after the onset of the attentional cue, the cluttered data more closely resembles the population representations of objects that were not shown at the attended location compared to the population representations of objects that were not shown at the nonattended locations. The plot on the lower right compares all the correlation coefficients shown in the other plots together. It can be clearly seen that after the onset of the attention cue, the cluttered data is more similar to the population representations for the attended object than for the nonattended objects, and that the cluttered data is more similar to the population representations for the nonattended objects than to the population representations for the objects that were not shown (red > green > cyan). Likewise, after the onset of the attention cue, the cluttered data is more similar to the population representations for objects at the attended location (solid lines) compared to the population representations of objects that are at the nonattended location (dashed lines). Thus attention enhances the population representations for both object identity and object position. These figures were created by running trying to decode each object at its exact location using a MCC classifier (training on isolated object data and testing on cluttered data), and then plotting the correlation values separately for the different attention conditions.