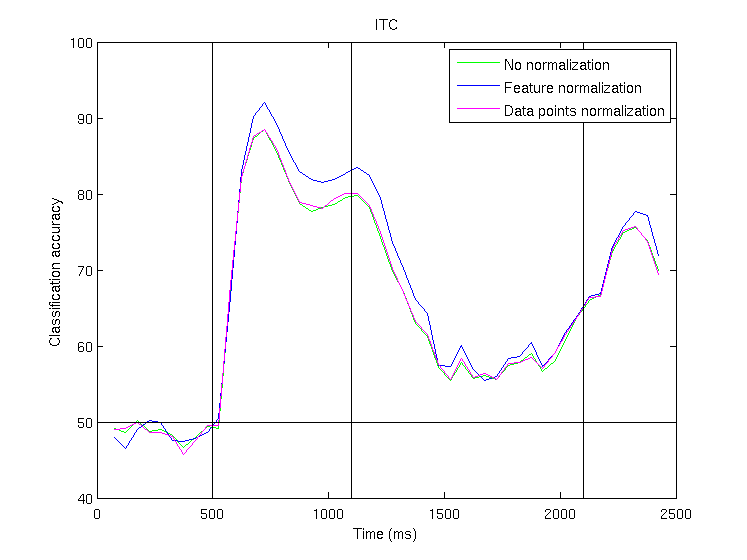
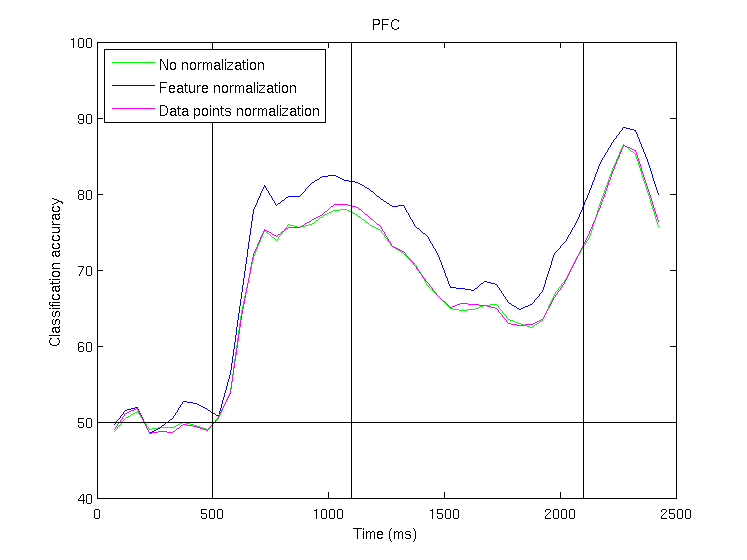
Comparison of different data normalizations
The results below show a comparison of decoding accuracies when the data has been
not been normalized (green line), when each feature has been z-score
normalized (blue line), and when each data point has been z-score
normalized (magenta line), for ITC (upper figure) and PFC (lower figure); by
z-score normalization we mean that the data (i.e., feature or data
point) has a mean of zero and a standard deviation of one. As
can be seen, slightly higher results are achieved when each feature
has been normalized (blue line); consequently this
normalization was
for all figures in the paper. The fact that z-score
normalization of
features increases decoding performance show that the best results are
achieved when each neuron is contributing equally, since z-score
normalizing of features makes all the firing rate of all neurons
(averaged over all stimuli) the same; this reduces the impact of
neurons that have high baseline firing rates, and increases the
influence of lower firing rates neurons. All results are based on
decoding basic sample-stimulus category information (the same type of
information shown in Fig. 2B). Data normalization parameters
for the feature normalization (i.e,. mean and standard deviation) were
gathered on the training set, and then applied to both the training and
test data.
Home