Is there category information in ITC during the sample
period? A comparison of decoding
analyses and the Category Selective Index analysis of Freedman et al.
2003
In
the original paper of by Freedman et al. (2003) analyses of the data
suggest that there is no category information in ITC during the sample
period, and
that category information does not appear in ITC until the delay
period. However in our new decoding based analyses, we find
that
there seems to be a significant amount of 'abstract' category
information in ITC early in the sample period. In order to
understand the different conclusion obtained by these different
analyses, we reexamined the category selective index (CSI)
used by Freedman et al. (2003) in more detail. The first
difference between the original CSI analysis and the decoding analysis,
is that in the CSI analysis, the firing rates were taken over much
longer time periods; i.e., the sample period in the original analysis
used firing rates averaged over 600ms starting 100ms after stimulus
onset and ending 100ms after stimulus onset, compared to the decoding
analysis in which firing rates in 150ms sliding bins were used.
From examining the decoding results (Fig. 3), it is clear
that
while early in the sample period decoding accuracies for abstract
category information PFC and ITC approximately the same, later in the
sample
period (and for the rest of the trial), PFC has a larger amount of
abstract category information than ITC. Thus by using large
time
windows of analysis, the fact that ITC and PFC initially have the about
same
amount of abstract category information could not be seen in the
original CSI analysis.
A second factor that contributed to this
discrepancy in results is that in the original CSI analysis an ANOVA
was first run to determine which neurons were visually selective, and
then the CSI values from only
these visually selective neurons were
used in the subsequent statistical analyses. However since
ITC
has many more visually selective neurons that are not category
selective (particularly during the sample period when the stimuli were
being shown), the results were biased by including a larger number
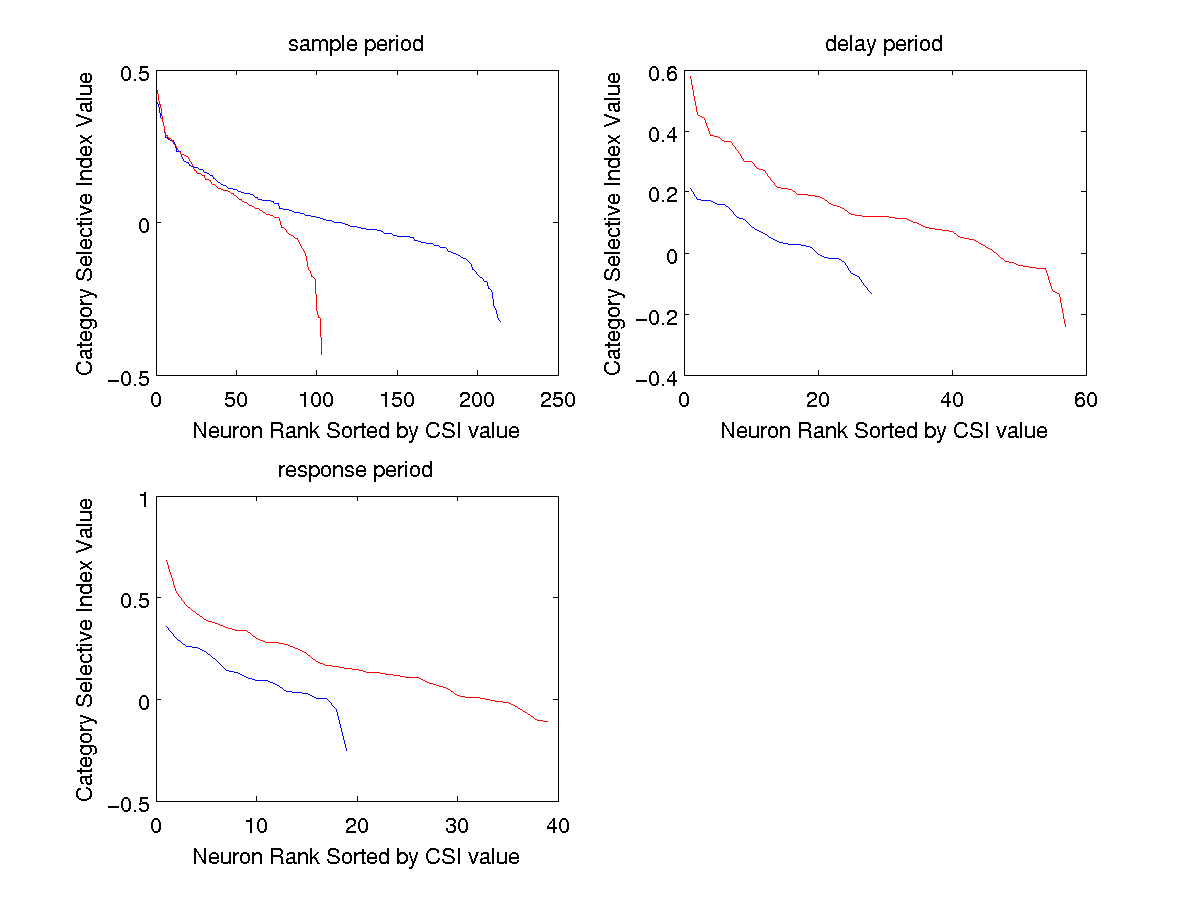
of neurons in ITC in these analyses. Below
is a
plot of the CSI values for ITC and PFC using exactly the same
parameters that were used in the original Freedman et al.
paper
(i.e., using only visually selective neurons as determined by and
ANOVA, and longer time bins), but we have sorted the CSI values and
then plotting them as a function of their rank order of their category
selectivity as determined by the CSI
value. As can be seen from the plot for the sample period,
the
neurons that have the highest CSI scores have approximately the same
values for ITC and PFC. However for ITC, there is a long tail
of
neurons that have CSI values that are close to zero (which are due to
the large number of visually selective neurons that are not category
selective). Thus when statistics are done using all visually
selective ITC neurons, the long tail of non-category selective neurons
biases the results towards zero, making it seem like the population as
a whole seem non-category selective. This should be
contrasted
with the results from the delay and response periods in which the
highest CSI values are larger for PFC than for ITC, and during these
time periods the decoding analysis agrees with the CSI values in
stating that there is more abstract category information in PFC than
ITC. It should also be noted that the decoding analyses that used
feature
selection (see section title 'compact and redundant information' and
Fig. 4), show that most of the
abstract category information is contained in a small subset of
neurons, thus calculating statistics based on larger populations can
lead to incorrect conclusions. Finally, if a t-test
is run
between the CSI values in ITC and PFC using all the neurons (not just the ANOVA visually selective neurons) during the
sample period (and even using the same larger time bins used in the
original paper by Freedman et al.), the p-value is .058, which fails to
meet the typical alpha level of .05 (and this value would probably be
even larger only the first half of the sample period was used in which
the decoding analysis indicates there is no difference in the amount of
category information between ITC and PFC).
Home