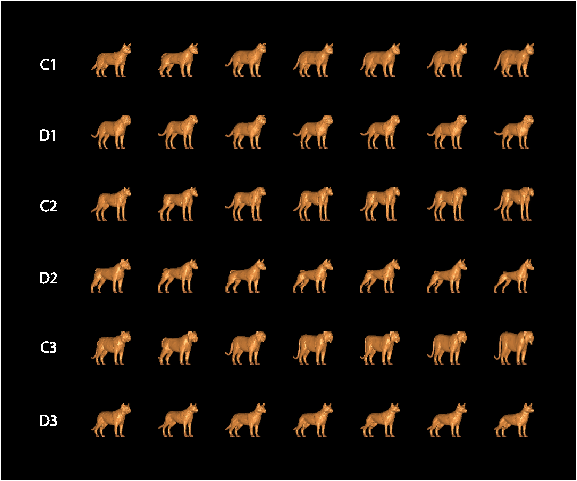
Figure S1.
All 42 stimuli that were shown during the
experiment. The
images in the cat category are in the rows listed C1, C2, C3, and the
images in the dog category are in the rows listed as D1, D2,
D3. As can be seen, all the images look very similar, and it
is not clear if the images in the cat category look more visually
similar to each other than they look to images in the dog category (and
vice versa for the dog category).
Home